Market Boom
116%. That’s the amount of increases in refinances compared with 1 year ago. Yes, mortgage rates have softened quite a bit this year. But will it continue? What about housing prices, will they climb or sink? Home pricing predictions for Quarter 4 and Quarter 1 of 2020 are in, and they are going to surprise you.
Refinance Boom
Before we dive into house prices and the state of the Phoenix market, let’s take a quick look at interest rates. A refinance boom is well underway, and it’s easy to see why. If you’ve bought a home in the past 3 years there’s a good chance you could save money by refinancing right now. The current rates of around 3.58% (as of today) have not been available since the end of 2016.
To keep that in perspective, the full range of interest rates in our country’s history have been as high as 18.63% in 1981 and as low as 3.31% in 2012. (30 year, fixed). That means we are just 0.27% off the record for lowest interest rates ever.
Before you jump in, remember, when you refinance a home, you do pay closing costs that can be anywhere from 1-2%. So while there are usually upfront fees, you’ll need to do some math and see how long it will take to cover that cost via reduced monthly payment and interest over the long term.
Pro Tip** – Many homeowners are eager to refinance their homes to save monthly, but will refinance their loans to a 30 year, even if they have 25 years left on their mortgage. This will of course save you extra money every month, but the smarter financial move for MOST people would be to refinance as the same or even less duration than you have left. YES, if you have 22 years left, you can refinance into a new 22 year loan, you are not stuck with only a 30 or 15. Everyone’s situation is different, just do the math and be logical about it.
Contact me if you need a recommendation for a good lender to refinance your property.
Phoenix Home Prices
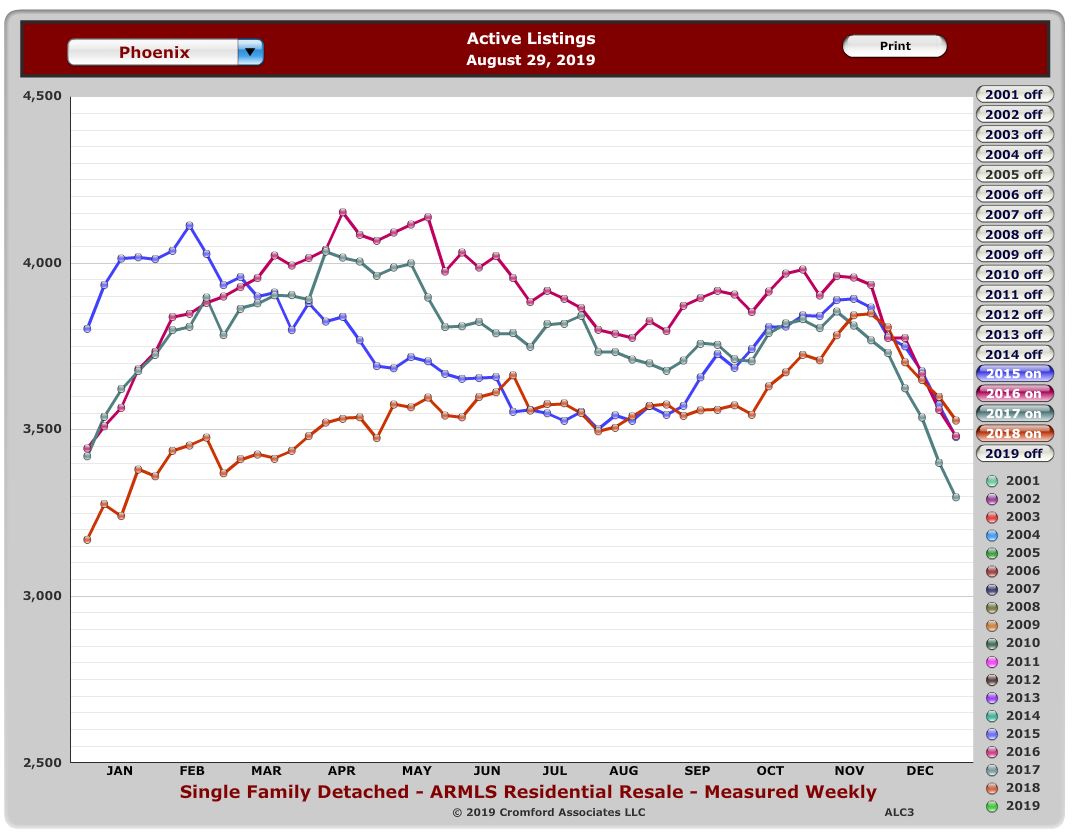
Something pretty unique is happening right now. In Phoenix, while we are a year round market, there are certainly high seasons, and low seasons, the trend is usually pretty predictable. Take a look at this graph which represents the amount of ACTIVE listings in Phoenix over the past 4 years.
We start the year off at a low, then in the spring time it increases to peak sometime between April June. July and August bring a gradual decline, then a small pop in September through November, followed by a steep drop off in December.
This year, (in green) while we are following that pattern, we are seeing FAR less active listings on the market than previous years.
So while demand has slowly picked up due to the near record low interest rates, supply has vanished. It doesn’t take long to figure out high demand with low supply can causes prices to soar.
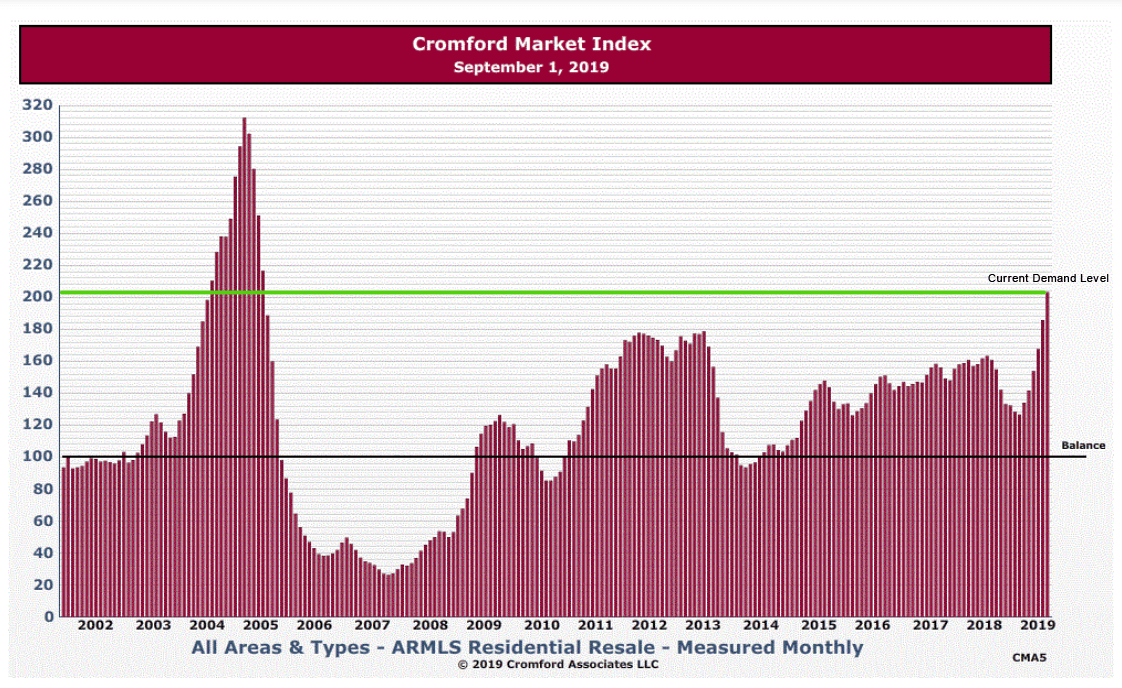
Supply and demand is the heart of what makes the real estate market tick. To track this for Arizona, I use the detailed analytics of the Cromford Report and the Cromford Market Index.
The Cromford Market index measures supply and demand for the major cities in the valley. A baseline number of 100 represents a balanced market, where buyers demand is matched by seller’s inventory, and prices remain unchanged. A number above 100, represents a sellers’ market. The higher the number, the stronger the sellers’ market. Alternatively, a number below 100, represents a buyers’ market.
Hopefully you are with me thus far, because there are some really important signs we are seeing from tracking this index. Typically a surge in the index, is not reflected in prices for several months down the line. As demand changes, it takes a while for the market to respond, new prices to be set and the uptrend started.
This past July and August, when we typically see the index lowering, we’ve actually seen a tremendous INCREASE. The market index average of all cities is over 200 for the first time since 2005. For reference, the Phoenix real estate market index peaked at over 300 at the height of “the bubble”. We are a LONG ways away from that sort of demand, but an average of 200 is very significant, as this is the highest demand levels we’ve seen in Phoenix in 14 years.
Here are some other statistics for you.
Demand is 8% above normal, while supply is 43% below normal
Active Listings: 13,609 versus 16,222 last year – down 16.1%
Pending Listings: 6,350 versus 5,262 last year – up 20.7%
Median Sales Price: $280,000 versus $262,000 last year – up 6.9%
So what’s the takeaway? Well, there is a really high probability this means prices are going to jump in the coming months/year. Assuming this trend continue through the end of the year and through the holidays, by the time the spring buying season comes around in 2020 buyers might be trampling over each other to get into homes.
Is it a good time to buy? Sell? Both if you ask me. Buying now during a traditionally slower time before a nice increase in values next year could be good way to start off your home ownership, it might be difficult next year. Not to mention locking in historically low interest rates if you were to buy now. But it’s also a good time to sell. Low inventory means buyers may pay more for your home, it may sell quicker, and you probably have a nice amount of equity built up.
Of course, we don’t ever know exactly what the market will do, or how long the trends will continue. There are always outside factors that can influence the real estate market. (2020 Election year?) For the foreseeable future, Phoenix area property values should continue to rise.


Comments are closed.