
2019 Mid Year Review
It’s hard to believe but 2019 is really halfway over. Before we start thinking about what the year 2020 will bring, it’s time to look back at what the real estate market has done in the first half of the year. Where are we now? Where will we go from here? The numbers are pretty interesting, let’s take a look.
Back in January, things were looking a little bit wobbly. Less homes were being sold, and more homes were hitting the market, which caused things to slow down a bit. At the same time, the stock market was slumping and was looking like a looming bear market. You could almost hear everyone collectively saying “It’s happening!”
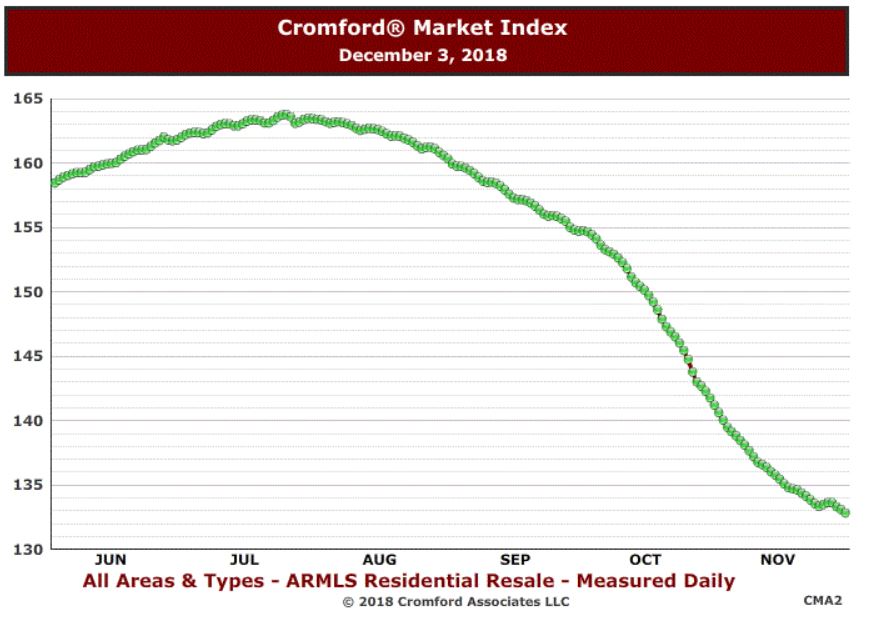
2019 started off with decreasing demand, and slumping sales leftover from second half 2018
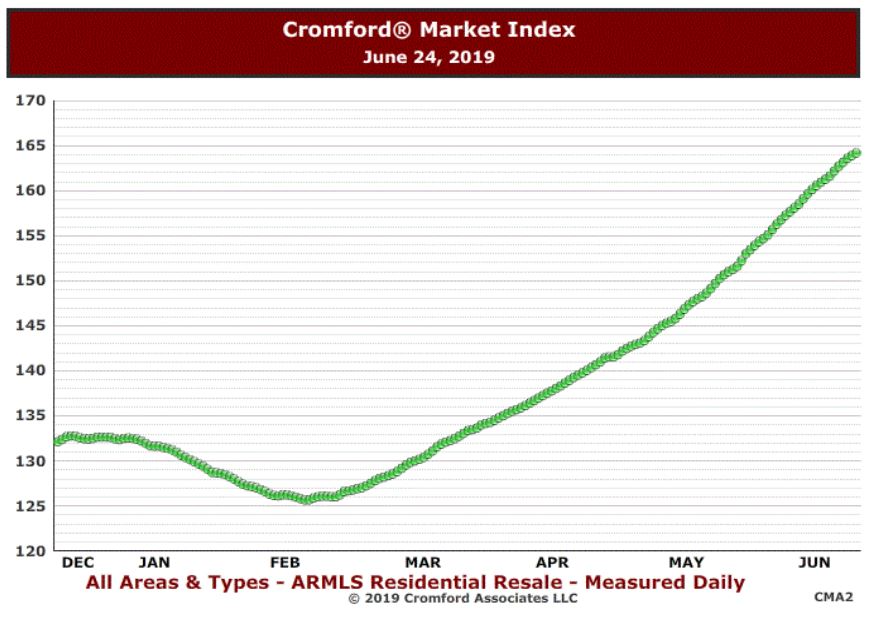
Fast forward 6 months to today, and that’s not quite the case. Slowly but surely the Arizona Markets picked up steam in the spring season, and produced incredibly strong numbers in both May and June. Now, July numbers are on the books, and the strong real estate market in the valley continues.
These are the core numbers compared from July 1, 2019 vs 1 year ago:
Number of Active Listings: 15,442 versus 16,101 last year – down 4.1% (Less listings = more demand)
Number of Pending Listings: 6,642 versus 6,092 last year – up 9.0%
Monthly Closed Sales: 9,463 versus 9,234 last year – up 2.5%
Monthly Average Sales Price per Sq. Ft.: $172.30 versus $163.43 last year – up 5.4%
Monthly Median Sales Price: $279,000 versus $268,000 last year – up 4.1%
Basic supply and demand tells us there are less listings available, and more properties being sold, increasing demand, and of course price.
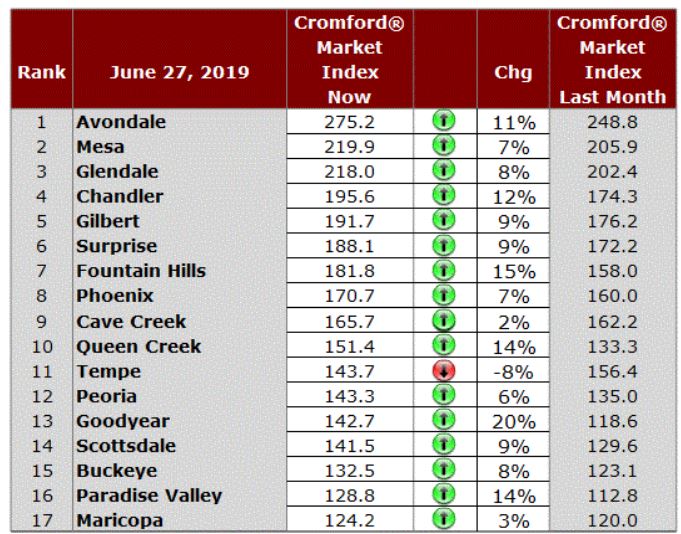
While all of the greater Phoenix remains a sellers’ market by definition, remember real estate can be hyper local. Some areas perform much better than others.
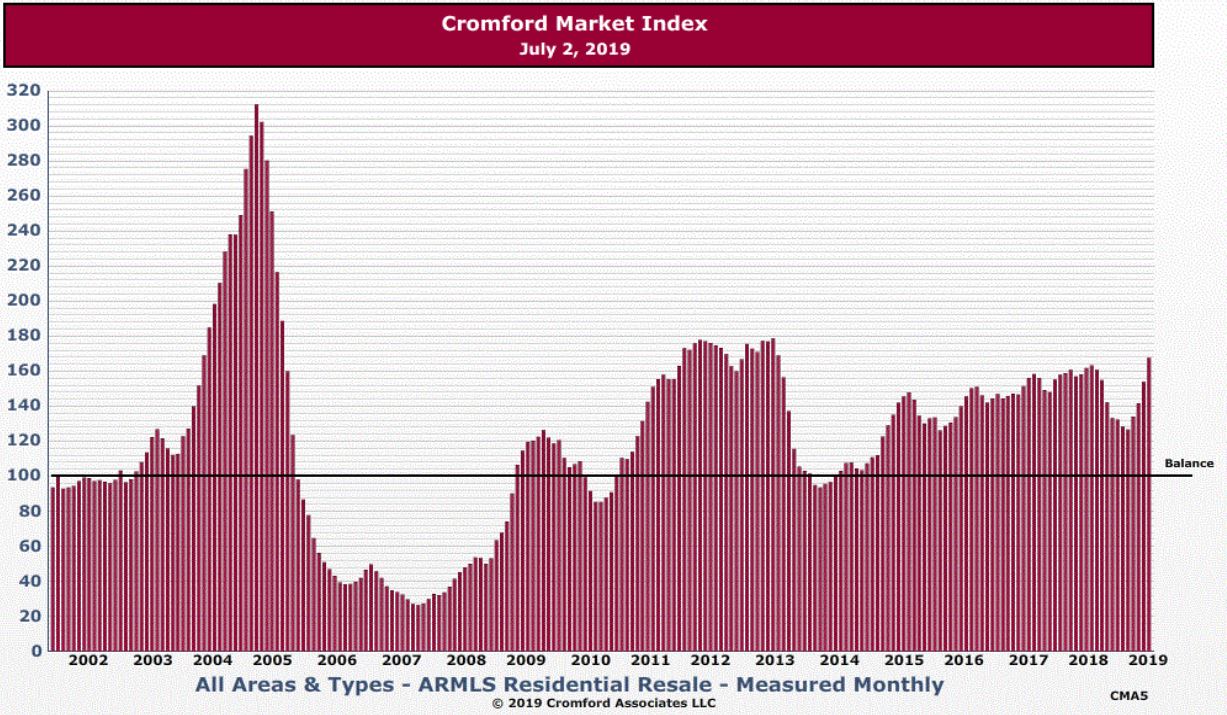
To accurately gauge a buyers or sellers’ market, it’s based off of an index known as the Cromford Market Index. On this index, 100 is considered a “balanced” market, where below 100 is a buyer’s market, and above 100 is a seller’s market. The higher the number above 100, the stronger the sellers market is in that city.
Every major city in the valley is above 100.
For perspective on this index, here is a chart going back to 2002. It’s easy to stack our current market next to the historic bubble, which we clearly are nowhere near the demand levels – thank goodness!
For anyone who has been sitting on the sidelines the last few years, renting has probably not gone easy on your wallet. Rental prices have continued to climb. The Phoenix market has passed a market wide average of $1 per foot to rent for the first time in history in June.
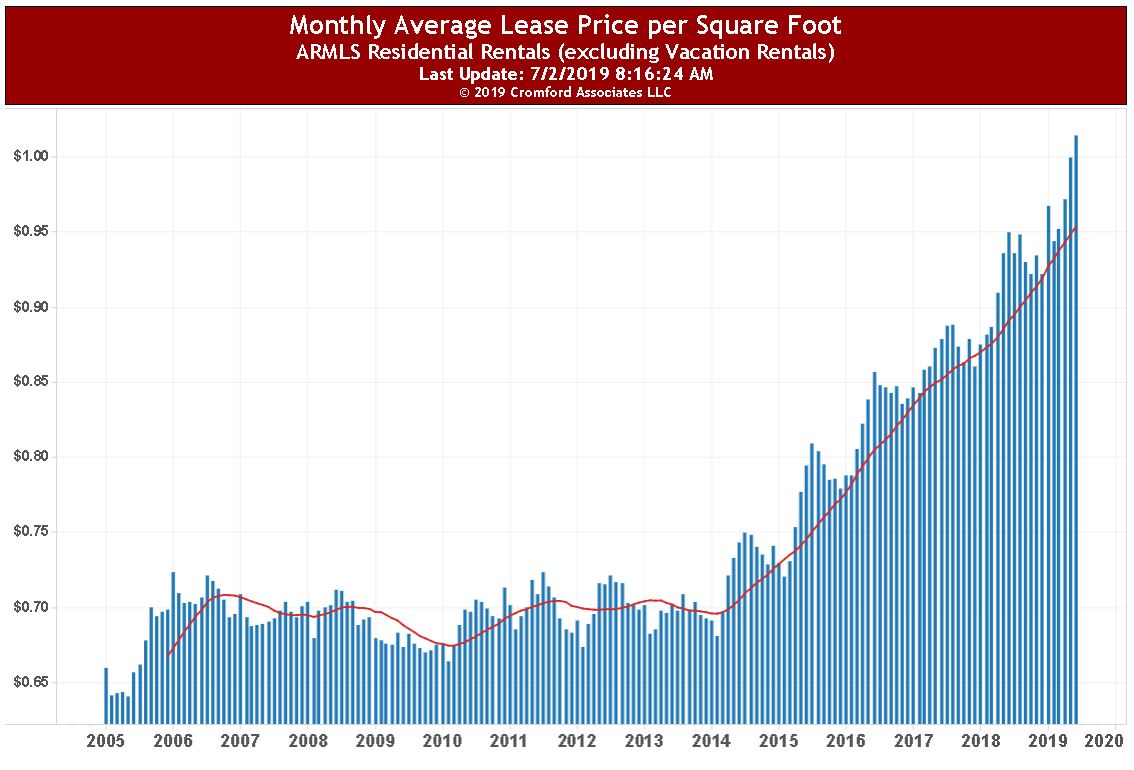
Maybe rent prices are the next real estate bubble? Or can this increases in rent keep on going? Comparatively, the average rent in LA is still over 3x that of Phoenix’s.
For the remainder of 2019, Phoenix will probably act like it usually does – a slow tapering off from July through December, with a small blip up in October. Supply should increase, which will ease demand. Since we are still in a quite strong sellers’ market, prices will continue to rise, albeit more slowly than the first half of the year.
Should you want detailed numbers/analysis on a particular city or zip code, please Contact Me.

Jon Knutson REALTOR
Comments are closed.