Wrapping up 2015 – Arizona’s growth
Like it or not, 2015 is quickly drawing to a close. If you follow mainstream media, chances are you’ve received mixed signals on this year’s Real Estate Market. It often humors me, some reports titled “housing market slammed with soft sales” right alongside another headline reading, “Will skyrocketing home prices cause another bubble?” So, how is the market? Are prices going up down or sideways? How much inventory is available? Well, it depends. Unfortunately so much statistical information provided to us is based off of nationally generalized data.
Here in Arizona we have been fortunate to see around 5.5% yearly growth according the most recent price index. If you lived in Vermont however, you were lucky to see 1.5%. Nevada? They are the current winner at over 11% growth. That’s all fine and dandy, but how do those numbers help you? What do they say about your neighborhood, let alone, zip code, city or county? Isn’t that what really matters?
The truth is, ask a Realtor how the market is performing and you just might get a different answer dependent on who you ask, but justifiably so. Here’s why – Different areas of town are performing very differently. As many Real Estate professionals focus on a particular area and price range, this is their small glimpse into how the market is performing. Not a true snapshot of the market as a whole, this can easily skew perspective on the direction of the market.
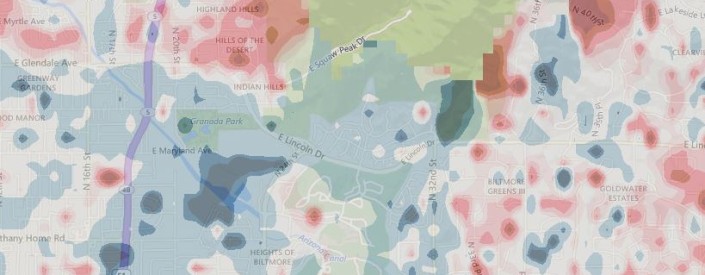
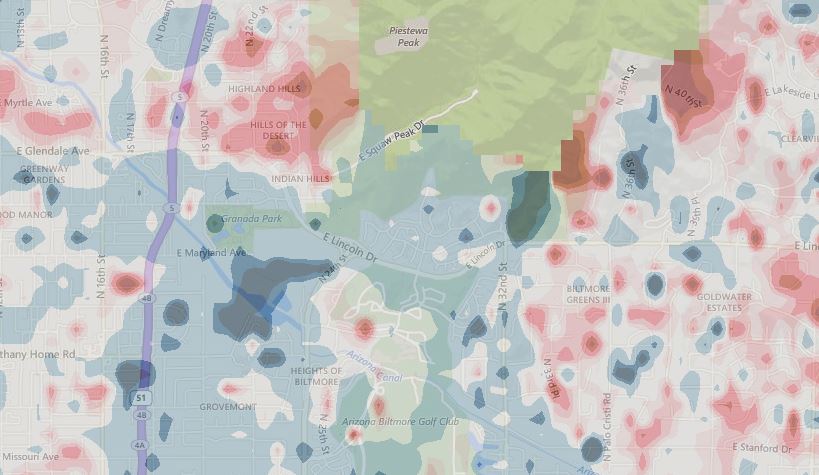
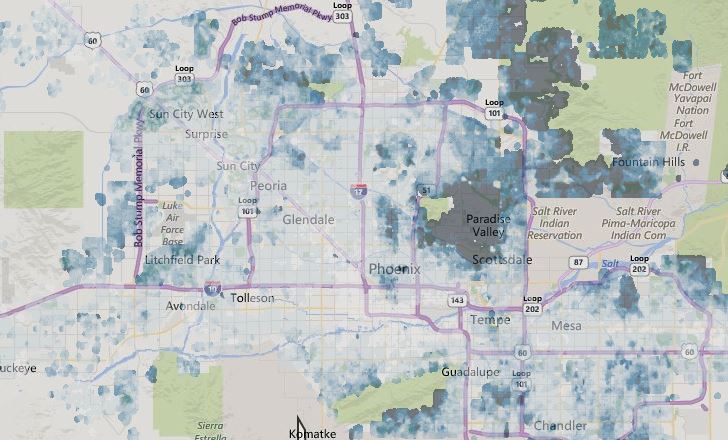
So how is your neighborhood performing? Take a look at the following heat maps to get an idea.

Biltmore Home Values 12 Month Change
![]()

Valleywide Price Changes
![]()
For Custom Heat Maps on a particular neighborhood, please submit a request.

Comments are closed.