

Market Conditions Changing
If you haven’t heard, the real estate market is shifting. I’ve had a lot of questions lately on the state of the market and where it’s going. Is it a good time to buy, sell or hold? Is there panic? I wanted to put together a detailed report and publish the data to show you exactly where we are at, and where we are most likely headed.
First, understand that the real estate market in Arizona is seasonal. Demand is highest during the spring, and lowest during the holidays. It’s 100% predictable. This chart for the last 5 years shows the amount of real estate transactions per month.
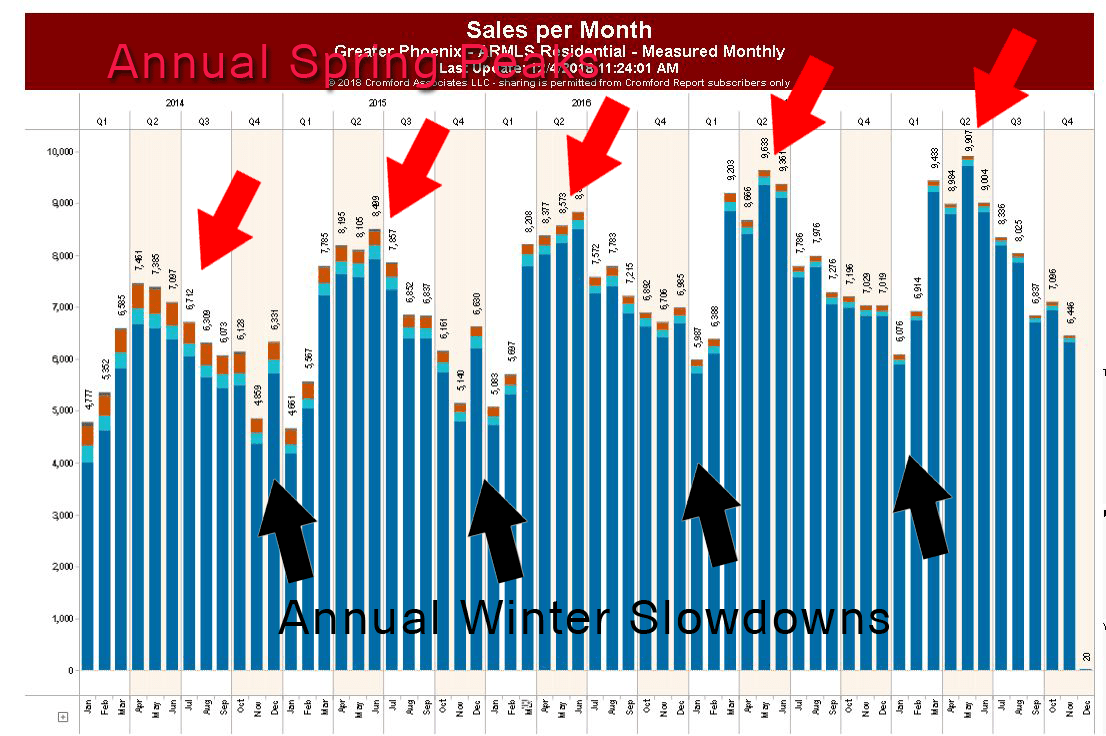
So is it any surprise that the last couple months have been a relatively quiet time? No, not at all.
However, there is more to the story.
The reported sales numbers first started to show some signs of change back in July. For this example we are using a number called the Cromford index. The Cromford index is an measurement that calculates a myriad of variables in the local real estate market to calculate a number that shows whether we are in a buyers market, sellers’ market, or neutral, for each of the biggest 17 major cities in the Phoenix Metro area.
The index in July, showed 9 of the 17 cities deteriorated very slightly for sellers.
Then, in August, the index showed that 11 of the 17 cities had deteriorated for sellers.
By the end of September,13 of our 17 major cities were showing deteriorated conditions for sellers.
In October AND November, 16 of the 17 cities were posting deteriorated conditions, and some with some large changes.
Paradise Valley is the only city remaining that has not showed a change in condition, and remained unchanged. This may be due to the lower number of units sold in PV compared to the rest of the valley.
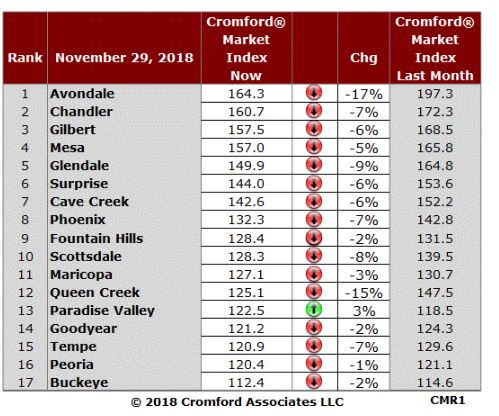
For reference on the above, a value of 100 is the baseline of a balanced market, where supply matches demand. Above 100, is deemed a sellers’ market. The higher the number, the more favorable conditions for sellers, and less favorable conditions for buyers. Below 100, is a buyers’ market, where the lower the number, the more favorable conditions are for the buyer and worse for a seller.
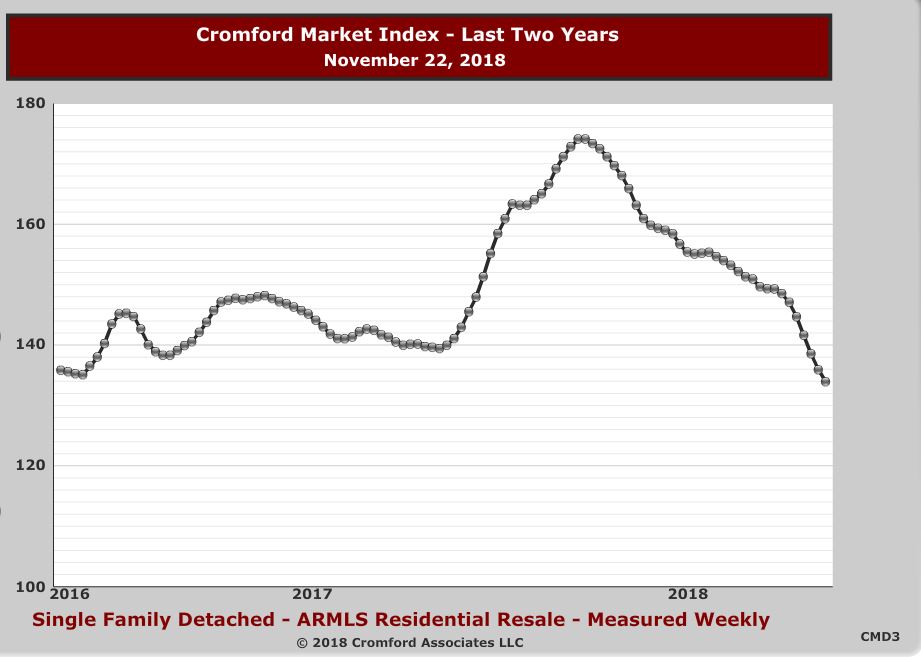
So what this shows us, is that despite demand taking a steep decline in the past several months all major cities are still at least somewhat in a sellers’ market. However, understand that the current 134 index rating as seen in Phoenix is a far cry from the 174 index peak from March of 2018 and is at the lowest point over the last two years.
Another way to measure the market by numbers, is compare the past month, with those same months of previous years.
As of December 1, 2018 valleywide:
The number of available listings are up 0.8% from last year – Relatively flat.
The number of Pending listings (under contract and soon to be sold) is down 18.2% from last year – This is quite a large change which is raising some eyebrows.
Average Sales Price per foot, up 7.5% from last year – Most of these gains were made in Quarters 1 and 2.
Median Sales Price is up 6.1% from last year – Again, most of the gains were made in Quarters 1 and 2. Note that the median sales price is DOWN 1.1% from last month.
So, does this mean we are in a bubble? No, not exactly. The absolute best way to squash the bubble idea is to look at real estate over the long run. Understand that a “normal” real estate market appreciates 2-3% per year.
What this chart below shows us are a few very important points:
- The peak of 2006 shows us what a bubble looks like in numbers. Compare this to our growth over the past few years, and you can see it’s completely different. 2004-2006 was completely out of the realm of normal.
- If we never had a bubble and a crash at all, we are almost perfectly in line with a market that appreciated between 2-3% each year from 2000 until now.
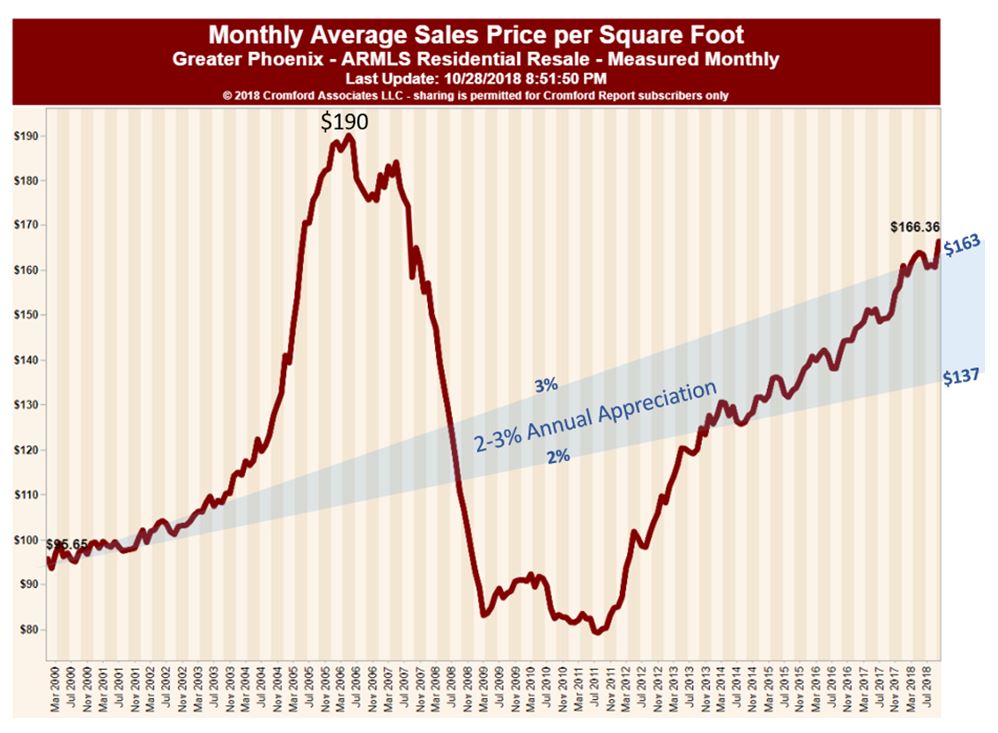
Right now, we are on the upper threshold of the “normal appreciation” forecast, and what we are most likely seeing is a small correction that will ease us back into the “normal” range. This is actually a good thing.
It’s easy to feel like “the markets been going up way too long, it’s going to crash”, which is founded on nothing but emotion and sentiment. You have to understand the first half of that appreciation run was making up for the over correction fallout of the crash.
So what does it all mean, and where are we going?
Although the market is softening, this is not a crash. One more time… THIS IS NOT A CRASH. The market is always striving for balance. It has been out of balance in favor of sellers for 4 years now, due to the low supply.
Increased supply is not bad news. It’s actually a healthy indicator the market is heading towards balance and “normalcy”.
Rentals
Let’s not forget about the rental market. There is a lot less analytics and data available on the rental segment, but I wanted to briefly share this. If you currently rent, or if you own rental property, you know that rent has gone through the roof lately.
Take a look at this average price per square foot for leases in the Phoenix area since 2005.
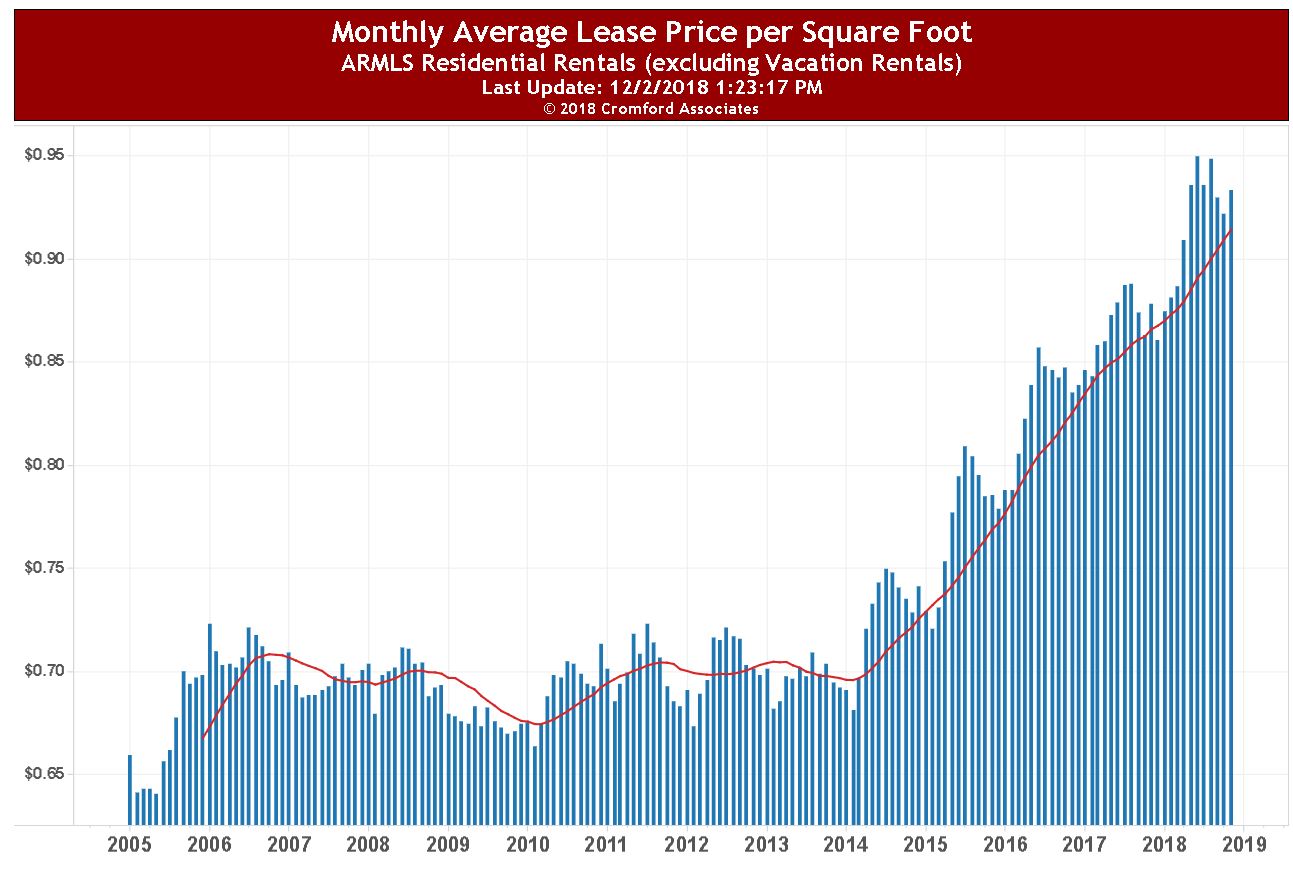
The interesting thing is that during the real estate bubble and crash the rental prices fluctuated just a few cents. Compare that to the last 5 years, we’ve increased from the 2014 low to the 2018 high, an increase of around 70%. That my friends, looks much more like a bubble in the rental market. Only time will tell how it corrects, but the yearly increase is certainly not sustainable long term.
Final Thoughts
Sellers
For the time being, you’ve lost a little bit of power to buyers. It’s still technically a sellers’ market, but only by a small margin in many areas. If you need to sell your home, your value is largely intact, but understand it may take a little longer, or you may need to be a little more flexible with buyer’s terms or financing to get a deal done.
Buyers
If you’ve tried to buy a home sometime in the last couple years and threw in the towel because you lost to cash investors, or everything was sold within 48 hours, now is a good time to get back in. We are not in a bubble, don’t worry about buying at the peak. While nobody can predict it perfectly, the most likely scenario is a 6-9 month cooldown before demand picks back up. Owning real estate is a long term investment. Interest rates have risen as expected, and they will more than likely continue to increase throughout 2019. Even if prices did come down a couple percent, interest rates will be rising which could negate the savings for financed buyers.
And Remember – These numbers are for Phoenix metro as a whole. Different price points, locations, types of housing have large impacts on this as well. If you would like a quick analysis, chart, or data on a particular neighborhood or area, please Contact Me and I would be happy to provide.

Jon Knutson REALTOR
Comments are closed.